
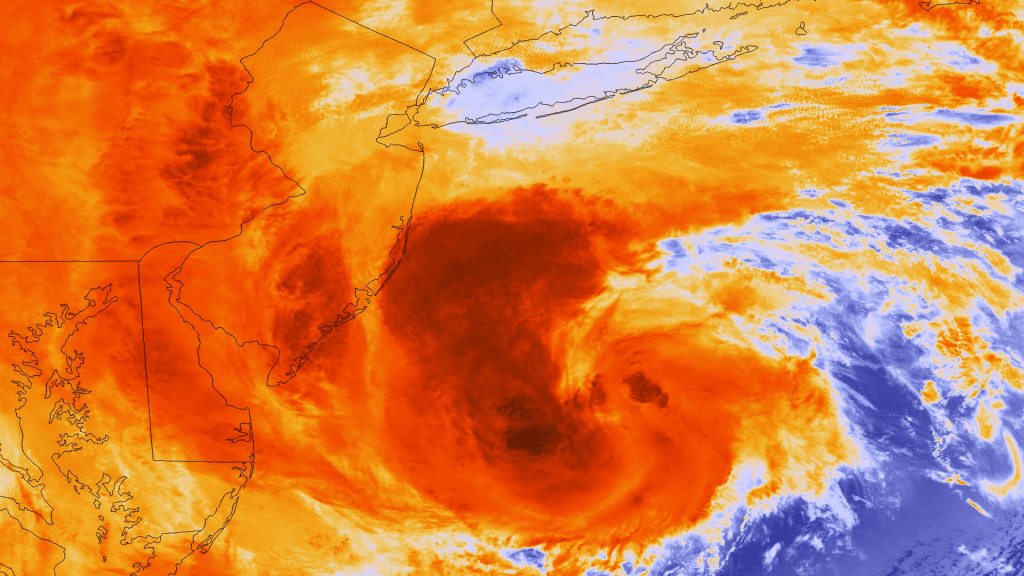
Between 2010 and 2020, there were 19 tropical cyclones that caused $502.1 billion in total damages and resulted in 3,653 deaths1. In August 2017, Hurricane Harvey was a Category 4 hurricane that made landfall in Rockport, Texas, inevitably causing $136.3 billion (CPI adjusted) in damages1. The rainfall caused by the hurricane was historic in nature, and resulted in the displacement of 30,000 people and the destruction of over 200,000 homes and businesses.
Hurricanes: What You Need to Know
Tropical Cyclone: is a generic term for a low-pressure system that formed over tropical waters with thunderstorm activity near the center of its closed, cyclonic winds
Naming conventions:
- Tropical Disturbance: lacks a closed circulation
- Tropical Depression: has a closed circulation but surface winds are under 39 mph
- Tropical Storm: has closed circulation that has winds over 39mph, at this point, the storm receives a name
- Hurricane/Typhoon: once winds exceed 74 mph, the storm becomes a hurricane (Atlantic or East Pacific Oceans) or typhoon (northern West Pacific)
The typical Atlantic hurricane season in the United States runs from June 1st to November 30th, while the East Pacific season runs from May 15th to November 30th. The National Oceanic and Atmospheric Administration (NOAA)’s August 2021 Atlantic Hurricane Season Outlook calls for a 70% probability for each of the following ranges of activity:
- 15-21 Named Storms
- 7-10 Hurricanes
- 3-5 Major Hurricanes
NOAA's forecast is of particular concern to utilities, as power grids are extremely vulnerable to the high winds and flooding caused by hurricanes. Incidentally, hurricanes are a leading cause of major power outages. Good examples of a hurricane's destructive capabilities are: Hurricane Irene in 2011, which left more than 6.5 million people without power; Hurricane Sandy in 2012, which affected 24 states and left more than 8.5 million customers in the U.S. without power; and Hurricane Irma in 2017, which caused 6.7 million customers in the state of Florida alone to lose power. In Puerto Rico, Hurricanes Irma and Maria caused such severe damage to the island's power grid, that it resulted in the longest power outage in U.S. history. These two hurricanes knocked down 80% of Puerto Rico's power poles and transmission lines.
With hurricanes being as destructive as they are, how can satellite imagery help utilities recover from storm damage?
Atmospheric Interactions
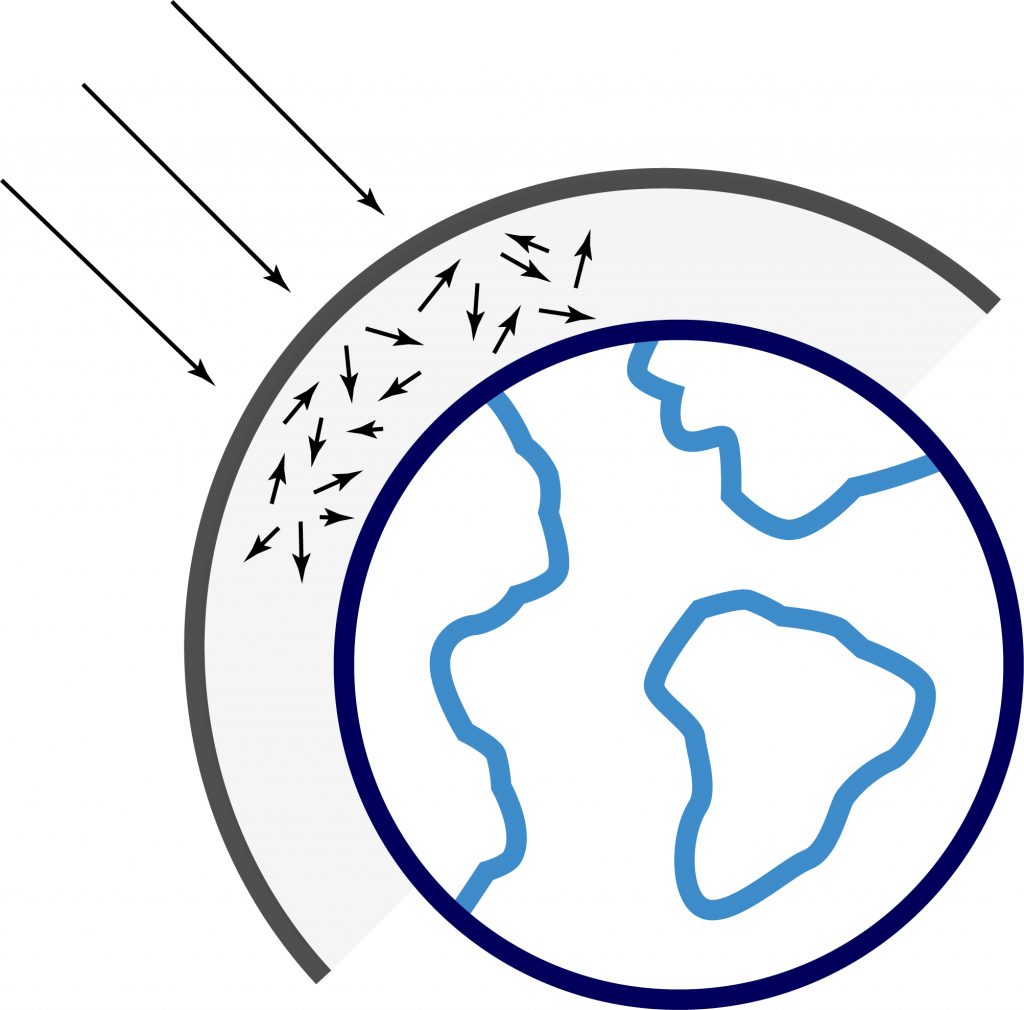
Remote sensing is reliant on solar radiation; that radiation needs to travel through the atmosphere before it reaches Earth’s surface. Gases and particles within the atmosphere can affect this radiation in a few ways, the focus of this article will be on the effects of Scattering. Scattering occurs when gas and particles within the atmosphere cause the electromagnetic radiation to redirect from its original path. There are three types of scattering that can occur:
#1. Rayleigh scattering: occurs when extremely small particles cause shorter wavelengths of energy to be scattered more than longer wavelengths. This is actually why the atmosphere appears “blue” during the daytime; because shorter blue wavelengths are being scattered more than the other visible wavelengths
#2. Mie scattering: occurs when medium-sized particles are about the same size as the wavelength (dust, pollen, water vapor). This occurs most typically in the lower atmosphere and is exceptional during cloudy, overcast days.
#3. Non-selective scattering: occurs when large-sized particles are larger than the wavelength (water drops, large dust particles, etc). This causes equal scattering of the wavelengths. It scatters the visible spectrum wavelengths equally, whichis actually the reason why clouds and fog look white.
Scattering negatively impacts the ability of some forms of satellites to capture data.
Passive vs Active Sensors and Scattering
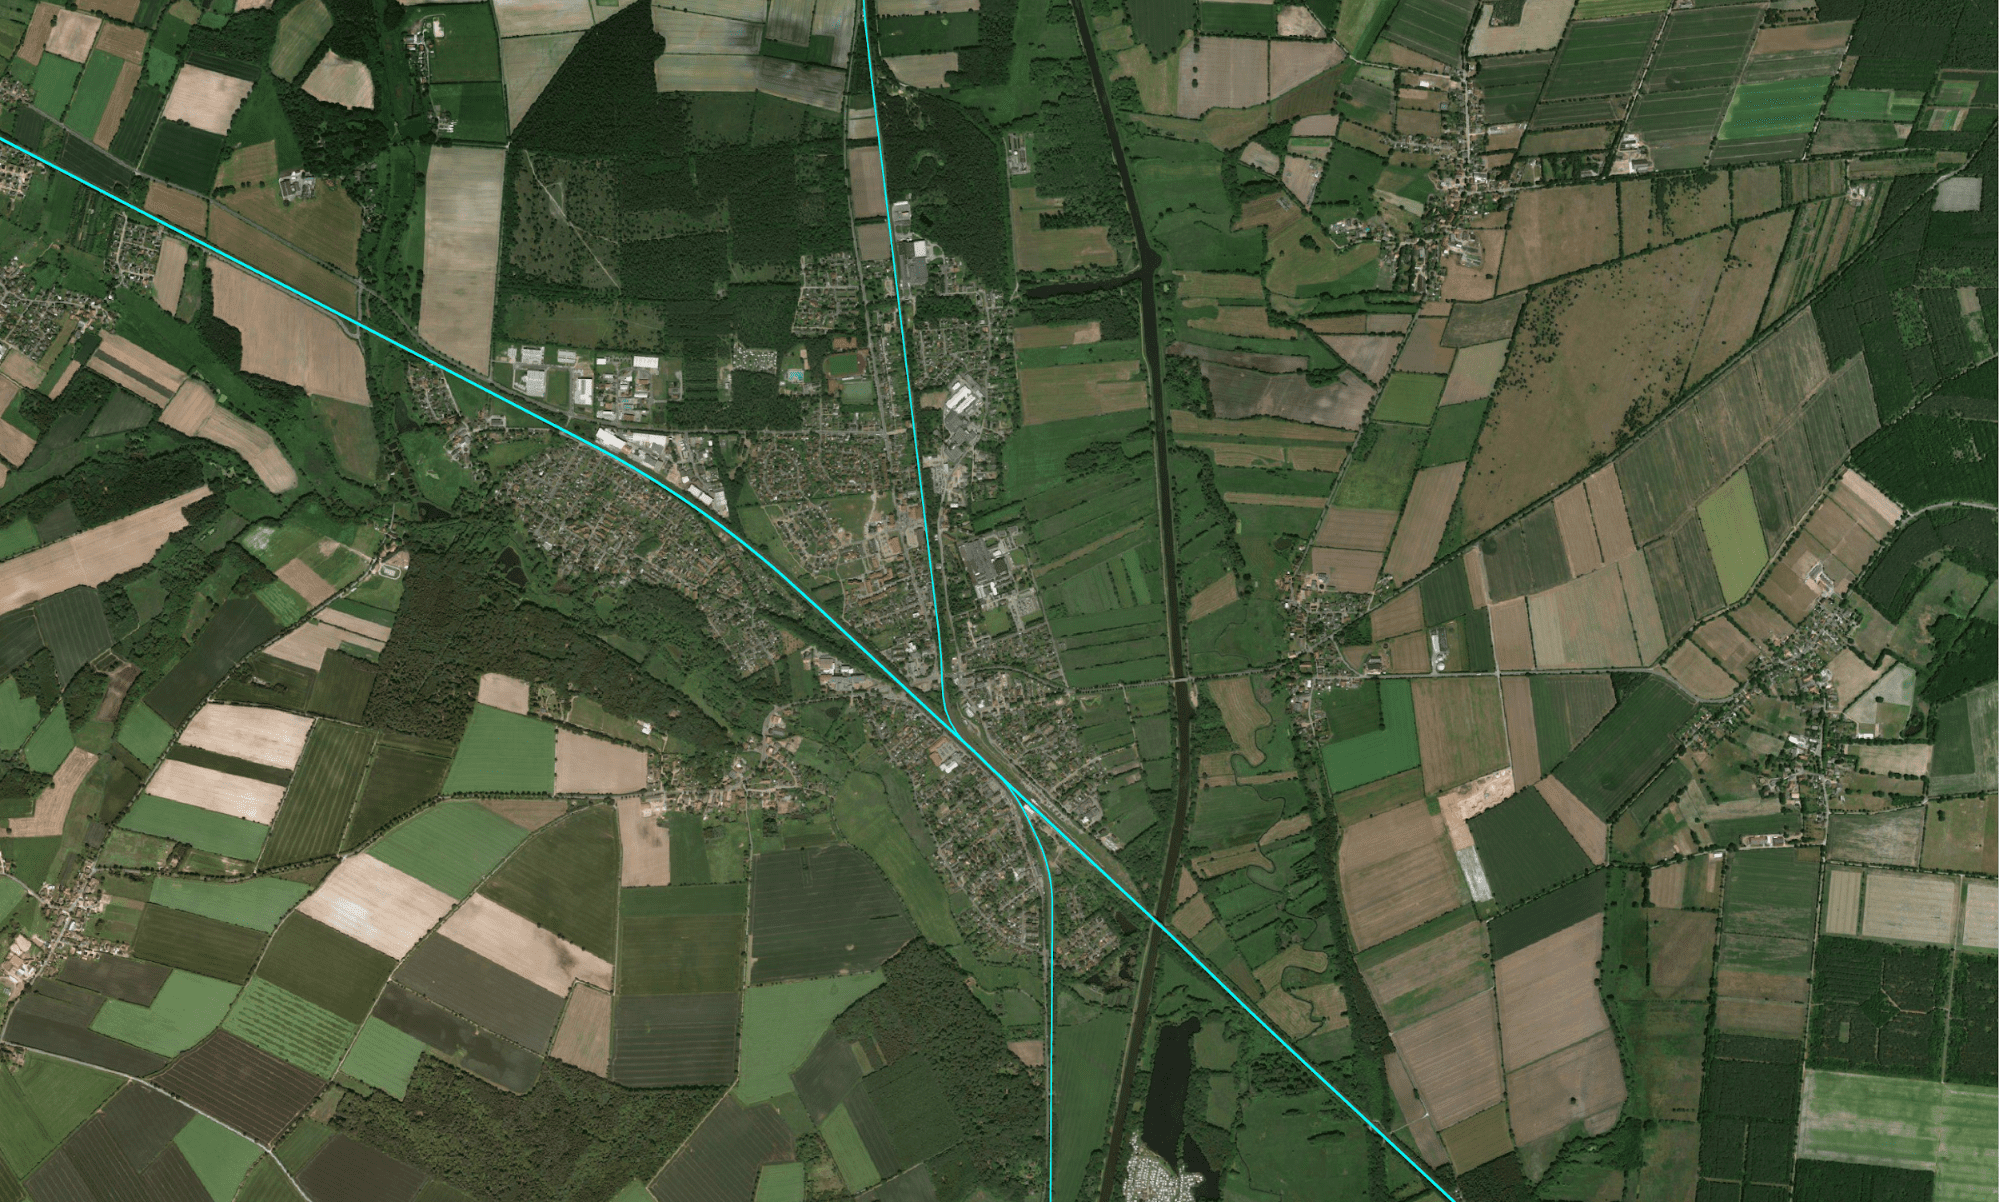
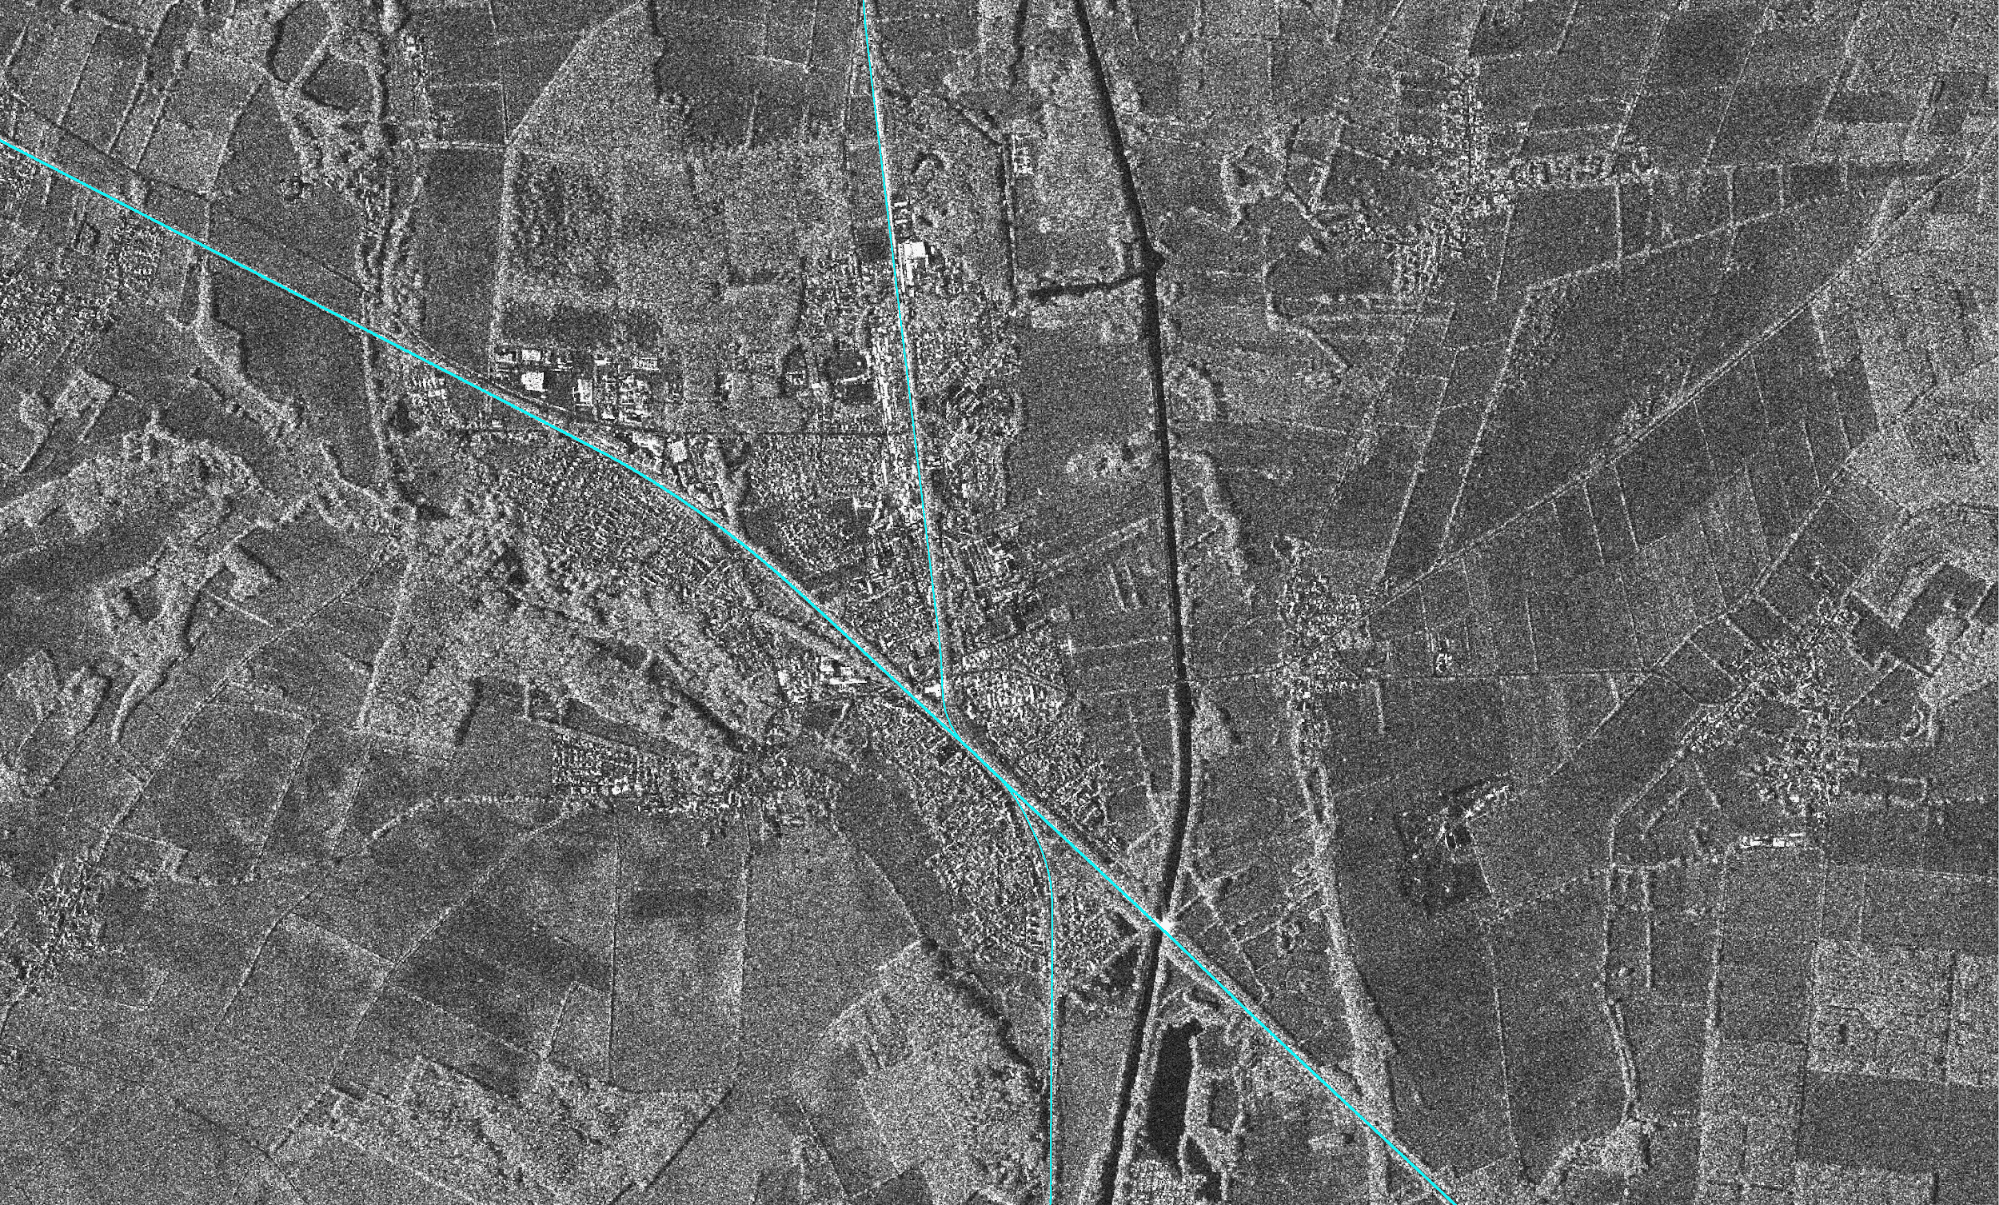
There are two types of sensors that are typically used by satellites - passive and active. Passive sensors measure the energy that is naturally available (solar radiation) while active sensors emit their own radiation. Optical imagery satellites typically rely on passive sensors, while Synthetic Aperture Radar (SAR) relies on active sensors. Unlike optical imagery satellites, SAR imagery is not affected by scattering since it does not measure within the visible spectrum, but within the microwave region of the electromagnetic spectrum; so days of heavy cloud coverage and bad weather do not affect SAR.
Right: High-resolution SAR image of the same AOI
Near Real-Time Storm Damage Detection
In order to minimize the length of a power outage and optimize damage repair processes, utilities need to know exactly where the damage has occurred along their power grid. This type of review is time-sensitive, and since hurricanes and storms typically have heavy cloud cover before, during, and after the storm, optical satellite imagery is not ideal.
In order to take advantage of innovative technology, LiveEO uses SAR data to perform time-critical post-storm damage analyses.
Upon being notified of a storm by our client, LiveEO tasks SAR satellites to capture the Area of Interest (AOI) before the storm hits and after it subsides in order to identify the damages that have occurred in between. LiveEO performs the AI-based analysis and provides the results within 24 hours of the acquisition of the second image.
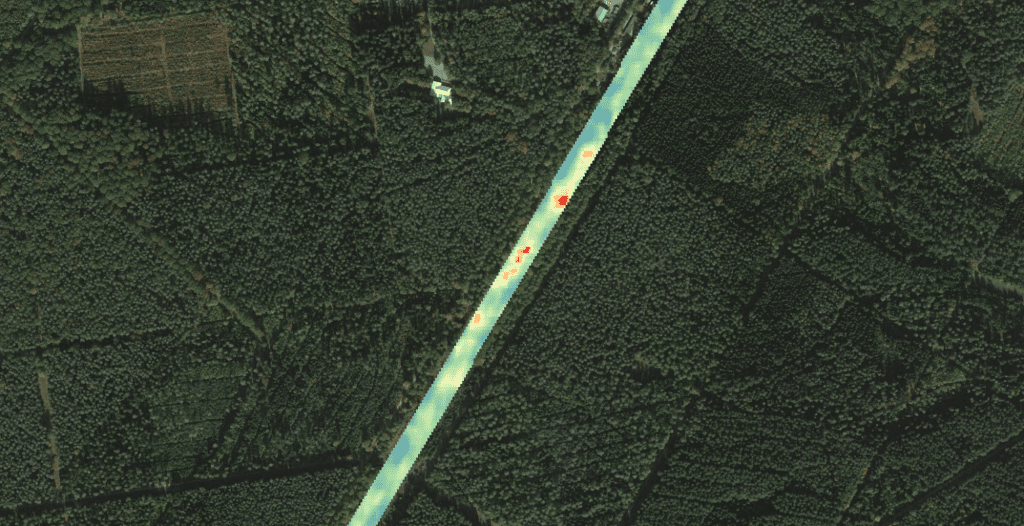
Heat map showing the intensity of the damage to the AOI
Utilizing our direct APIs with major satellite providers and our advanced machine learning techniques, LiveEO is able to provide individual detections and heatmaps of damage extent shortly after the event. Optical data can then later be used to help track remedial action progress.
{{inline}}
Understanding how you can leverage remote sensing and satellite data to help plan post-disaster recovery is essential to a strong restoration strategy. Having an accurate map of damage hotspots around power lines can help provide a precise and safe evaluation of the damaged area.
Contact us a free initial consultation to identify if and how satellite data can support you to recover quickly from future storm events.
Sources:
1. National Oceanic and Atmospheric Administration’s National Centers for Environmental Information (NCEI) U.S. Billion-Dollar Weather and Climate Disasters (2021). https://www.ncdc.noaa.gov/billions/, DOI: 10.25921/stkw-7w73
2. NOAA’s Atlantic Oceanographic and Meteorological Laboratory. (2021). Hurricane FAQ. https://www.aoml.noaa.gov/hrd-faq/#1569507388495-a5aa91bb-254c
3. National Oceanic and Atmospheric Administration (NOAA). (2021, August 4). Atlantic hurricane season shows no signs of slowing. https://www.noaa.gov/news-release/atlantic-hurricane-season-shows-no-signs-of-slowing.
4. Lin, N. Tropical cyclones and heatwaves. Nat. Clim. Change 9(8), 579–580 (2019).
5. Executive Office of the President. (2013, August). ECONOMIC BENEFITS OF INCREASING ELECTRIC GRID RESILIENCE TO WEATHER OUTAGES. https://www.energy.gov/sites/prod/files/2013/08/f2/Grid%20Resiliency%20Report_FINAL.pdf
6. National Oceanic and Atmospheric Administration (NOAA). (2021). Sandy’s Legacy – Improved Storm Surge Prediction Tools : North Atlantic Region.
https://www.regions.noaa.gov/north-atlantic/highlights/sandys-legacy-improved-storm-surge-prediction-tools/#:%7E:text=The%20National%20Hurricane%20Center%20estimated,8.5%20million%20customers%20without%20power
7. United States Government Accountability Office. (2021, March). Report to Congressional Addressees: Opportunities Exist for DOE to Better Support Utilities in Improving Resilience to Hurricanes. https://www.gao.gov/assets/gao-21-274.pdf